Data Analysis: A Practical Approach for Absolute Beginners


Rp500,000 Rp0
- Description
- Unit Outline
- Instructor
- Additional information
- Certificate
- Reviews (0)
Description
About this course
Digital transformation and advanced technologies like AI and quantum computing are fueled by data. Every industry and profession needs data analysis, from a small business’s survey data to CERN’s 100’s of petabytes per experiment. Analyzing data is one of the most critical skills of the future.
This course, meant for people of all ages, will bring you from the very beginnings of data concepts and structures in context, all the way through analyzing data, telling data stories effectively, and understanding the environments in which data exists throughout our work and life. It will also start you on the path to becoming a data analyst. Throughout the course, we’ll reference additional courses and learning paths you can take to help you on your data career journey.
What you’ll learn
Estimate Time : 18 hours
This course has six modules.
- Our Data-Driven World: Learn to look at the world through the lens of data and to understand things from a fundamental transactional and representational level, all the way through to data fluency and how organizations and governments, not to mention people, from around the world run and organize their life around the flow of data.
- Our First Data Walkthrough: Dive right in and run through a complete analysis of a real-world data set involving gas mileage, engine size, and other factors related to a group of car models. You’ll also learn to make insights, explore scatterplots, break out one variable by another factor, and calculate correlations.
- Our Data Structures: Find out where data come from as well as how they are used, stored, and interpreted. You’ll also explore the different types of data and learn how to join two data sets into a single table using different methodologies.
- Our Data Analysis Methods: You’ll get into the specifics of how to use math and visualization techniques to summarize, distribute, and present data in a compelling way.
- Our Data Analysis in Context: Explore how data insights work in the real world and in the context of a couple specific industries. You’ll also get a crash course in data ethics and the wide variety of possible careers in the field of data analysis.
- Final Exam and Challenge Labs: Take a 20-question, multiple-choice Final Exam and complete one Challenge Lab.

Ben Olsen
Sr. Content Developer at Microsoft
Ben is a Sr. Content Developer for Microsoft’s Learning and Readiness team, and is an analytics professional and educator with over 8 years of industry and managerial experience. Prior to joining Microsoft, Ben ran and directed multiple consulting firms, where he also held critical analytics roles in companies as diverse as Juniper Networks, Costco, and T-Mobile. He has taught Data Visualization at The University of Washington, and recently founded Seattle Pacific University’s Analytics Certificate Program.

Dr Tom Carpenter
Data Science and Research Consultant
Baylor University
Tom Carpenter is a freelance data science and research consultant and owner of Tom Carpenter PhD Consulting. Tom has a PhD in Social Psychology from Baylor University (doctoral minor in statistics). Tom has worked for several years as a freelance research consultant and statistician with several companies and research organizations, and he also teaches research and statistics. Tom’s passion is helping people hear the story in their data and to draw sound statistical inferences from that data.

Trevor Barnes
Additional information
| Author / Publisher | Microsoft |
|---|---|
| Level | Intermediate |
| Language | English |
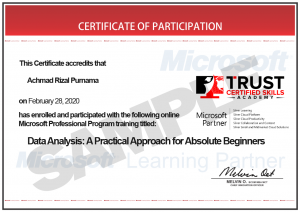
Certificate
When you enrolled into this course you will automatically get a Certificate of Participation for completing the course. An example is provided below.
Only logged in customers who have purchased this product may leave a review.


Reviews
There are no reviews yet.