Essential Math for Data Analysis using Excel Online

Rp500,000 Rp99,000
- Description
- Unit Outline
- Instructor
- Additional information
- Certificate
- Reviews (0)
Description
About this course
What you’ll learn
- Handle data sets for analysis purposes
- Understand beginning mathematical notation
- Work with different types of data
- Summarize data with distributions and graphs
- Apply summary statistics to analyze and understand data sets
- Calculate business metrics and KPIs to derive business value from data sets
- Apply basic inferential math to data
- Use tools to forecast future trends in data
Estimate Time : 18 hours
Module 1: Introduction to Data and Variables
Module 2: Summarizing Data with Distributions and Graphs
Module 3: Summary Statistics
Module 4: Business Statistics
Module 5: Introduction to Inferential Math and Forecasting

Ben Olsen
Sr. Content Developer at Microsoft
Ben is a Sr. Content Developer for Microsoft’s Learning and Readiness team, and is an analytics professional and educator with over 8 years of industry and managerial experience. Prior to joining Microsoft, Ben ran and directed multiple consulting firms, where he also held critical analytics roles in companies as diverse as Juniper Networks, Costco, and T-Mobile. He has taught Data Visualization at The University of Washington, and recently founded Seattle Pacific University’s Analytics Certificate Program.

Dr Tom Carpenter
Data Science and Research Consultant
Baylor University
Tom Carpenter is a freelance data science and research consultant and owner of Tom Carpenter PhD Consulting. Tom has a PhD in Social Psychology from Baylor University (doctoral minor in statistics). Tom has worked for several years as a freelance research consultant and statistician with several companies and research organizations, and he also teaches research and statistics. Tom’s passion is helping people hear the story in their data and to draw sound statistical inferences from that data.

Trevor Barnes
Additional information
| Author / Publisher | Microsoft |
|---|---|
| Level | Intermediate |
| Language | English |
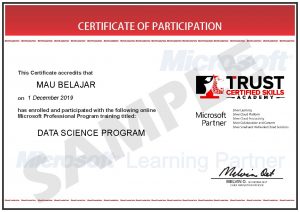
Certificate
When you enrolled into this course you will automatically get a Certificate of Participation for completing the course. An example is provided below.
Only logged in customers who have purchased this product may leave a review.


Reviews
There are no reviews yet.